Datasource: Statistics Agency under the President of the Republic of Uzbekistan | Datastorage: GitHub
data
Code
data_raw <- read.csv2(
  "https://raw.githubusercontent.com/sultanovf/my_datasets/refs/heads/main/priceuz_202101-202411.csv")


price_uz <-
  data_raw |>
  select(-runame) |>
  add_column(runame, .after = "enname" )

datseq <- as.character(seq(as.Date("2021-01-01"),as.Date("2024-11-01"), by = "month"))
new_colnames <- c("uzname", "enname", "runame", unlist(strsplit(datseq, ",")))
colnames(price_uz) <- new_colnames


rmarkdown::paged_table(sample_n(price_uz, 10)) # show sample 10 rows
# oder {r, df_print = "paged"}
# sample_n(data_raw, 10
dataclean
Code
# add column catecory
df_data <- price_uz |>
  select(-enname) |>
  filter(uzname %in% filtermap) |>
  mutate(
    category = case_when(
      uzname %in% gosht ~ "Мясо",
      uzname %in% sabzavot ~ "Овощи",
      uzname %in% oziqovqat ~ "Питание",
      uzname %in% yog ~ "Mасло",
      TRUE ~ "Другой"
    )
  )

# pivot data
df_piv <-
  df_data |>
  pivot_longer(
    cols = !c(uzname, runame, category),
    names_to = "date",
    values_to = "price"
  ) |>
  mutate(
    date = as.Date(date)
  )

df_piv |>
  sample_n(7)
#> # A tibble: 7 × 5
#>   uzname       runame           category date        price
#>   <chr>        <chr>            <chr>    <date>      <dbl>
#> 1 Tovuq goshti Курица           Мясо     2024-11-01 31441.
#> 2 Tovuq goshti Курица           Мясо     2021-05-01 23033.
#> 3 Guruch       Рис              Питание  2022-04-01  9560.
#> 4 Yog(paxta)   Масло(хлопковое) Mасло    2023-10-01 16024.
#> 5 Sarimsoq     Чеснок           Овощи    2022-08-01 16018.
#> 6 Kartoshka    Картофель        Овощи    2024-07-01  4228
#> 7 Shakar       Сахар            Питание  2021-09-01  8506.
prepare data for plot
Code
df1 <-
  df_piv |>
  filter(
    runame %in% c("Баранина", "Говядина", "Масло сливочное", "Курица")
  ) |>
  mutate(
    images = case_when(
      runame == "Баранина" ~ paste0(img_path,uzname,".png"),
      runame == "Говядина" ~ paste0(img_path,uzname,".png"),
      runame == "Масло сливочное" ~ paste0(img_path,uzname,".png"),
      runame == "Курица" ~ paste0(img_path,uzname,".png"),
      TRUE ~ uzname

    ),
    frame = row_number()
  )

head(df1)
#> # A tibble: 6 × 7
#>   uzname     runame   category date        price images                    frame
#>   <chr>      <chr>    <chr>    <date>      <dbl> <chr>                     <int>
#> 1 Mol goshti Говядина Мясо     2021-01-01 59082. gallery_img/products/Mol…     1
#> 2 Mol goshti Говядина Мясо     2021-02-01 59243. gallery_img/products/Mol…     2
#> 3 Mol goshti Говядина Мясо     2021-03-01 59595. gallery_img/products/Mol…     3
#> 4 Mol goshti Говядина Мясо     2021-04-01 60338. gallery_img/products/Mol…     4
#> 5 Mol goshti Говядина Мясо     2021-05-01 61163. gallery_img/products/Mol…     5
#> 6 Mol goshti Говядина Мясо     2021-06-01 61628. gallery_img/products/Mol…     6
plot
Code
# Title/subtitle/legendtitle
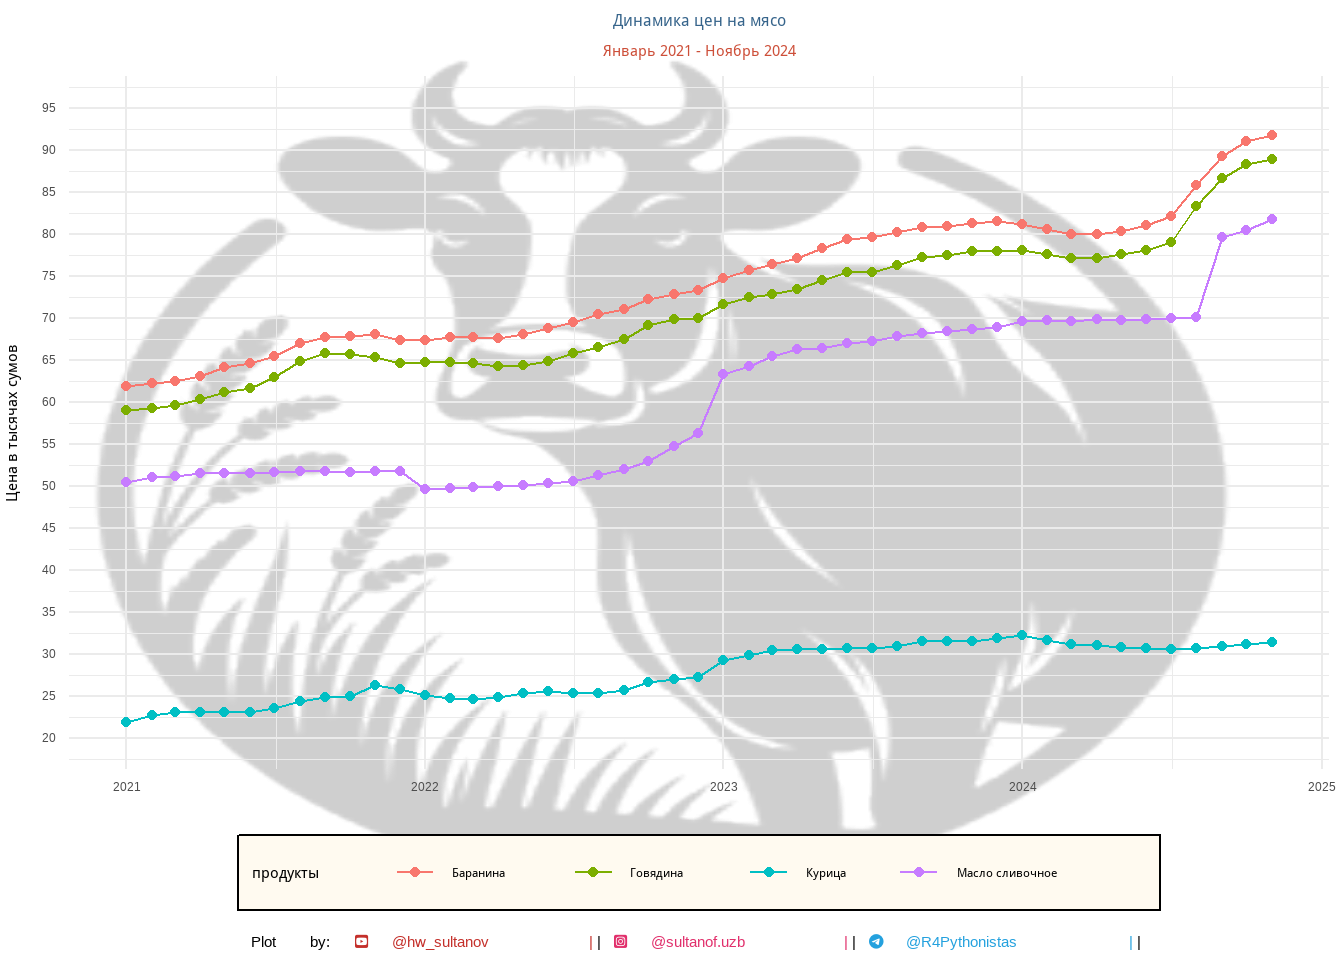
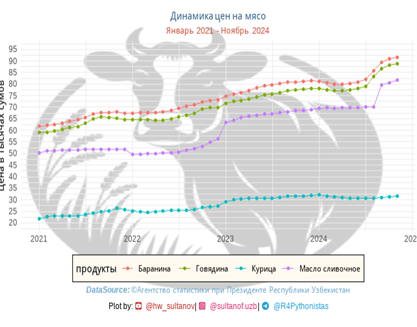
t <- paste("Динамика цен на мясо")
st <- paste("Январь 2021 - Ноябрь 2024")
p <- paste("продукты")
pp <-
df1 |>
ggplot(aes(x = date, y = price, color = runame)) +
geom_line()+
geom_point()+
scale_y_continuous(limits = c(20000,95000),breaks = seq(20000, 95000, 5000),
labels = function(x) paste(x/1000)) +
scale_x_date(date_labels = "%Y") +
#guides(fill = guide_legend(title = "Produkt"))+ #change legen title not worked
labs(
#fill = p, #change legen title not worked
title = t,
subtitle = st,
caption = cap,
y = "Цена в тысячах сумов",
x = NULL)+
theme_minimal()+
theme(
plot.title = element_text(size = 12, color = "steelblue4", face = "bold", hjust = 0.5),
plot.subtitle = element_text(size=11, color = "tomato3", face = "bold", hjust = 0.5),
plot.caption = ggtext::element_markdown(size = 11, hjust = 0.5),
legend.position = "bottom",
legend.box.background =element_rect("floralwhite"))
mol <- "gallery_img/products/Mol goshti1.png"
pp$labels$colour = "продукты" #change legen title
p1 <- ggbackground(pp, mol, alpha = .5, color = "gray")
p1
plot animated
Code
# icon ----------------------------------------
f_path <- "C:/Users/sultanov/Documents/fontawesome/otfs/"
font_add('Font Awesome 6 Brands', paste0(f_path, "Font Awesome 6 Brands-Regular-400.otf"))  # social

showtext::showtext_auto()

p2 <-
  df1 |>
  ggplot(aes(x = date, y = price, fill = runame)) +
  geom_line()+
  geom_point()+
  geom_image(aes(image=images),  size=0.12)+
  geom_label(aes(label = as.character(price)), size = 3.5 ,hjust = 1.2, colour= "white")+
  # scales
  scale_y_continuous(limits = c(20000,95000),breaks = seq(20000, 95000, 5000),
                     labels = function(x) paste(x/1000)) +
  scale_x_date(date_labels = "%Y") +
  # Labs/titles
  labs(
    title = t,
    subtitle = "{format(frame_along, '%Y - %B')}",
    caption = cap,
    y = "Цена в тысячах сумов",
    x = NULL,
    fill = p)+   # funktioniert wenn aes oben fill, wenn color nicht
  # Theme format
  theme_minimal()+
  theme(
    plot.title = element_text(size = 14, color = "steelblue4", face = "bold", hjust = 0.5),
    plot.subtitle = element_text(size=12, color = "tomato3", face = "bold", hjust = 0.5),
    plot.caption = ggtext::element_markdown(size = 12, hjust = 0.5),
    #legend.title = element_markdown(p), #change legen title not worked
    legend.position = "bottom",   #c(0.90, 0.13)

    legend.box.background =element_rect("floralwhite"))+
  # animate
  # transition_time(date) # keine Linie
  transition_reveal(date)
p2

## render and Save
# anim_p <-
#   p2 |>
#   animate(
#     duration = 20,
#     fps = 10,
#     start_pause = 5,
#     end_pause = 10,
#     height = 533,
#     width = 833,
#     renderer = av_renderer()
#   )
#
# anim_p

#anim_save("C:/Users/sultanov/YandexDisk/f-sultan/temp/r/gganimate/plots/price_5.mp4", price_5 = a1)
Back to top