Datasource: Statistics Agency under the President of the Republic of Uzbekistan | Datastorage:
data
Code
<- read.csv2 ("https://raw.githubusercontent.com/sultanovf/my_datasets/main/nikohuz_2010_2023.csv" )<- paste (2010 : 2023 ) #, sep=",", collapse= "," <- unlist (strsplit (years, "," ))<- c ("region" , "status" , "area" , years)colnames (data) <- new_cnames:: paged_table (sample_n (data, 10 )) # show sample 10 rows # oder {r, df_print = "paged"} # sample_n(data_raw, 10
pivot data
Code
<- data# pivot data <- |> pivot_longer (cols = ! c (region, status, area),names_to = "year" ,values_to = "value" |> sample_n (7 )
#> # A tibble: 7 × 5
#>   region             status   area    year  value
#>   <chr>              <chr>    <chr>   <chr> <int>
#> 1 Samarkand region   divorce  village 2021   2226
#> 2 Bukhara region     marriage city    2020   5422
#> 3 Kashkadarya region divorce  city    2023   1790
#> 4 Navoi region       divorce  city    2015    711
#> 5 Samarkand region   marriage city    2010  11116
#> 6 Navoi region       marriage city    2012   3867
#> 7 Jizzakh region     marriage village 2010   6870
prepare data for plot
Code
<- |> pivot_longer (cols = ! c (region, status, area),names_to = "year" ,values_to = "value" |> group_by (year, status) |> summarise (value = sum (value)) |> mutate (#frame = row_number(), year = as.integer (year),value = case_when (== "divorce" ~ round (value/ 1000 , 1 )*- 1 ,TRUE ~ round (value/ 1000 , 1 ))|> ungroup ()head (df_pl)
#> # A tibble: 6 × 3
#>    year status   value
#>   <int> <chr>    <dbl>
#> 1  2010 divorce  -14.3
#> 2  2010 marriage 273.
#> 3  2011 divorce  -15.1
#> 4  2011 marriage 269.
#> 5  2012 divorce  -14.3
#> 6  2012 marriage 280.
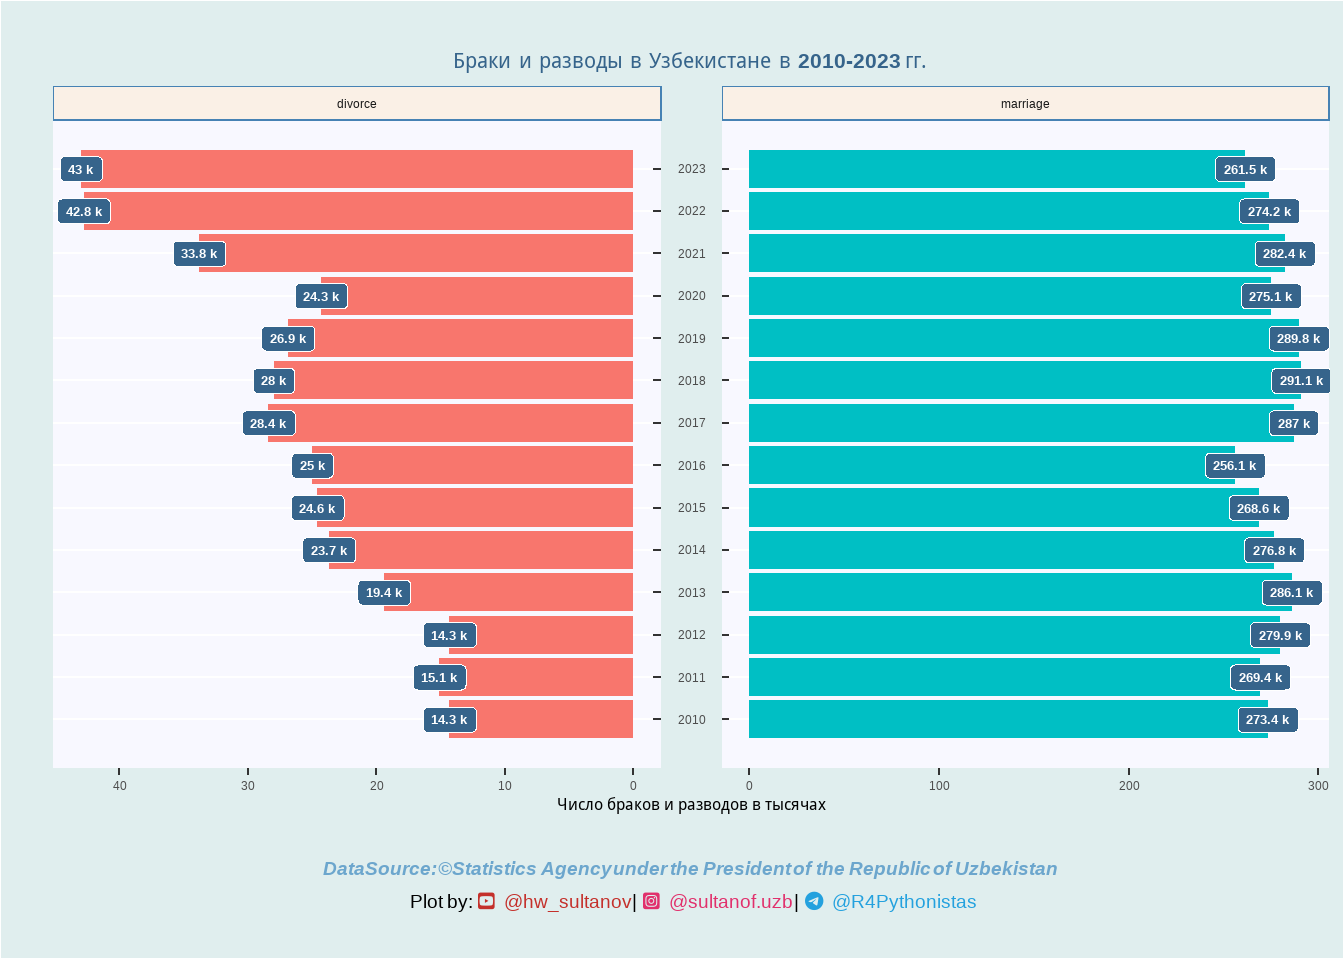
pyramid #1
Code
# Title/subtitle/datasource <- "©Statistics Agency under the President of the Republic of Uzbekistan" <- "<br>Браки и разводы в Узбекистане в 2010-2023 гг." <- "" # caption <- glue:: glue ("<span style = 'color:skyblue3;'><i><strong><br>DataSource: {data_source} <br/></strong></i></span> Plot by: <span style='color: #C4302B; font-family: \" Font Awesome 6 Brands \" ;'>{yt_icon};</span> <span style='color: #C4302B'>{yt_username}</span> | <span style='color: #e1306c; font-family: \" Font Awesome 6 Brands \" ;'>{ins_icon};</span> <span style='color: #e1306c'>{ins_username}</span> | <span style='color: #24A1DE; font-family: \" Font Awesome 6 Brands \" ;'>{tg_icon};</span> <span style='color: #24A1DE'>{tg_username}<br></span>" # caption <- glue:: glue (" <span style='color: #C4302B; font-family: \" Font Awesome 6 Brands \" ;'>{yt_icon};</span> <span style='color: #C4302B'>{yt_username}</span> | <span style='color: #e1306c; font-family: \" Font Awesome 6 Brands \" ;'>{ins_icon};</span> <span style='color: #e1306c'>{ins_username}</span> | <span style='color: #24A1DE; font-family: \" Font Awesome 6 Brands \" ;'>{tg_icon};</span> <span style='color: #24A1DE'>{tg_username}<br></span>" <- "C:/Users/sultanov/Documents/fontawesome/otfs/" :: font_add (family = 'Font Awesome 6 Brands' , regular = paste0 (f_path, "Font Awesome 6 Brands-Regular-400.otf" )):: showtext_auto ()
Code
# create plot <- ggplot (df_pl, aes (x= year, y= value, fill= status)) + geom_bar (position = position_dodge (width= 1 ), stat= 'identity' ) + scale_x_continuous (breaks = c (seq (2010 ,2023 )), labels = c (seq (2010 ,2023 , 1 )))+ geom_label (aes (label = paste (abs (value), "k" )),colour = "white" , fill = "steelblue4" , fontface= "bold" , size= 3.5 ) + # facet with ggpol facet_share (~ status, dir = "h" , scales = "free" , reverse_num = TRUE )+ coord_flip () + # title, cap, .. labs (title = p_title,caption = social_caption,y = "Число браков и разводов в тысячах" ,x = NULL + # theme, format theme_update ()+ theme (plot.title = element_markdown (size = 16 , color = "steelblue4" , face = "bold" , hjust = 0.5 ),plot.caption = ggtext:: element_markdown (size = 14 , hjust = 0.5 ),legend.position = "none" ,axis.title.x = element_text (size = 12 ),panel.grid.major.x = element_blank (),panel.grid.minor.x = element_blank (),panel.grid.minor.y = element_blank (),panel.background = element_rect (fill = "ghostwhite" ), plot.background = element_rect (fill = "azure2" ),strip.background = element_rect (fill = "linen" , color = "steelblue" )# Show plot
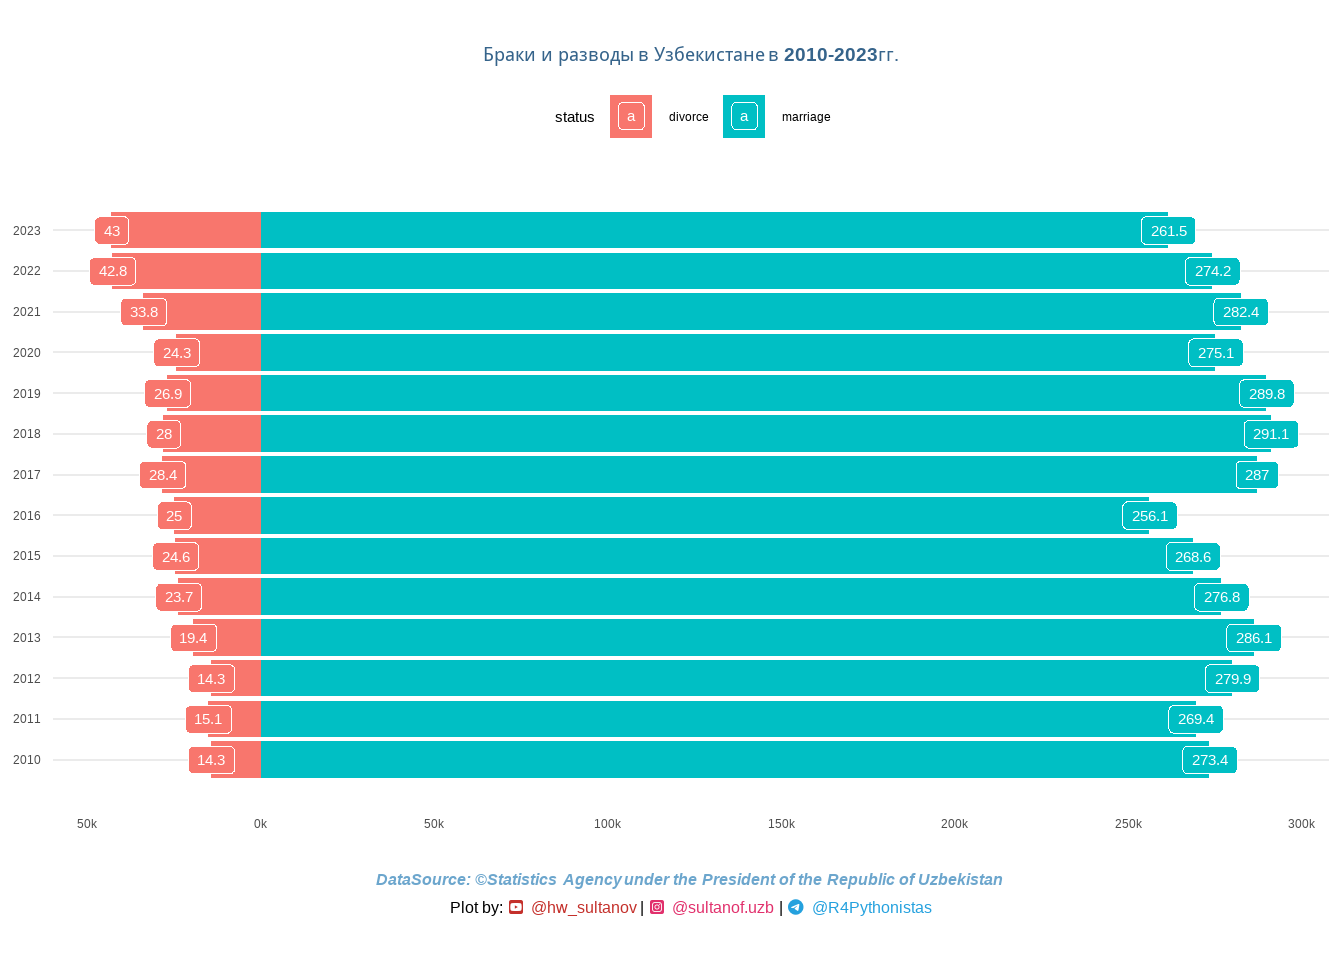
barplot
Code
<- ggplot (data = df_pl,aes (x = year, y = value, fill = status)) + geom_bar (stat = "identity" ) + #, position = "dodge" scale_y_continuous (breaks = c (seq (- 300 , 300 , by = 50 )), #labels = c(seq(300, 0, -50), seq(50, 300, 50)), labels = function (x) paste0 (abs (x), "k" )) + scale_x_continuous (breaks = c (seq (2010 ,2023 )), labels = c (seq (2010 ,2023 , 1 )))+ coord_flip () + geom_label (aes (label= abs (value)), color = "white" ) + labs (title = p_title,caption = social_caption,y = NULL ,x = NULL ) + theme_minimal ()+ theme (plot.title = element_textbox (size = 14 , color = "steelblue4" , face = "bold" , hjust = 0.5 ),plot.caption = ggtext:: element_markdown (size = 12 , hjust = 0.5 ),legend.position = "top" ,panel.grid.major.x = element_blank (),panel.grid.minor.x = element_blank (),panel.grid.minor.y = element_blank ()# show plot
animated plot for marriage
Code
# marriage <- |> filter (status == "marriage" ) |> mutate (value = abs (value)) |> # weil df_pl divor values nigativ ggplot (aes (x = as_factor (year), y = value, fill = value))+ geom_col ()+ scale_colour_brewer (type = "div" , palette = "BuGn" , direction = 1 )+ scale_y_continuous (limits = c (0 , 300 ),breaks = seq (0 , 300 , 50 ),labels = function (x) paste0 (x, "k" ))+ geom_text (aes (label = round (value)),vjust = 1.5 , nudge_y = 0.5 , color = "white" , size = 4 )+ labs (title = "Заключенные браки" , #: {closest_state} #subtitle = "{closest_state}", caption = social_caption_anim,y = "Количество браков (в тысячах, k = 1000)" ,x = NULL ) + theme_minimal ()+ theme (plot.title = element_text (size = 16 , color = "steelblue4" , hjust = 0.5 ),plot.caption = element_textbox (size = 14 , hjust = 0.5 ),axis.title.y = element_text (size = 11 , vjust = - 0.5 ),legend.position = "none" ,panel.grid = element_blank (),panel.grid.major.y = element_line (color = "white" ),panel.ontop = TRUE ,+ #scale_fill_distiller(palette = "red", direction = -1) + transition_states (year, wrap = FALSE , transition_length = 14 )+ #ease_aes("cubic-in-out")+ view_follow (fixed_y = TRUE )+ shadow_mark ()#plt_anim <- animate (duration = 15 ,start_pause = 5 ,end_pause = 10 ,renderer = gifski_renderer ()
animated plot for divorce
Code
# divorce <- |> filter (status == "divorce" ) |> mutate (value = abs (value)) |> # weil df_pl status=divorce values nigativ ggplot (aes (x = as_factor (year), y = value, fill = value))+ geom_col ()+ scale_fill_distiller (palette = "Reds" , direction = 1 )+ scale_y_continuous (limits = c (0 , 50 ),breaks = seq (0 , 50 , 5 ),labels = function (x) paste0 (x, "k" ))+ geom_text (aes (label = round (value,1 )),vjust = 2 , nudge_y = 0.5 , color = "steelblue4" , size = 4 )+ labs (title = "Разводы" , #: {closest_state} caption = social_caption_anim,y = "Количество разводов (в тысячах, k = 1000)" ,x = NULL ) + theme_minimal ()+ theme (plot.title = element_text (size = 16 , color = "steelblue4" , hjust = 0.5 ),plot.caption = element_markdown (size = 14 , hjust = 0.5 ),axis.title.y = element_text (size = 11 , vjust = - 0.5 ),legend.position = "none" ,panel.grid = element_blank (),panel.grid.major.y = element_line (color = "white" ),panel.ontop = TRUE ) + #scale_fill_distiller(palette = "red", direction = -1) + transition_states (year, wrap = FALSE )+ #ease_aes("cubic-in-out")+ view_follow (fixed_y = TRUE )+ shadow_mark ()#plt_anim <- animate (duration = 15 ,start_pause = 5 ,end_pause = 10 ,renderer = gifski_renderer ()