population in CIS countries in bar plot, range plot and treemap (animated) using ggplot2 and gganimate
ggplot2
gganimate
plot of share of social network users population in CIS countries using ggplot2 and gganimate
plotting (animated) the marriages and divorces over the years in Uzbekistan using ggplot2 and gganimate
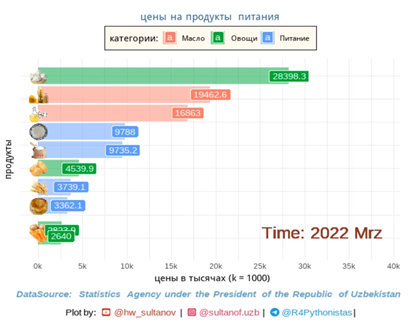
#part_2: an animated barplot for the development of food price of some products in Uzbekistan over the years and months using ggplot2 and gganimate
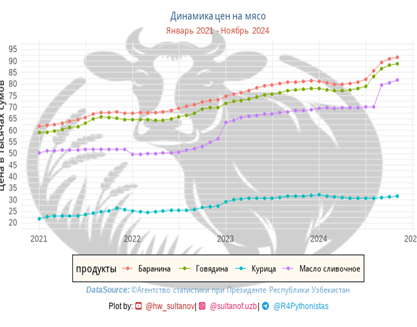
#part_1: an animated lineplot for the price development of of meat products in Uzbekistan over year and months using ggplot2 and gganimate
create a mapplot, bar chart and funnel chart from a real dataset using ggplot2 and plotly
plotly
(animated) scatterplot with ggplot and plotly in R and Python using the example of GDP per Capita and Life expectancy for CIS countries
ggplot
ggimage
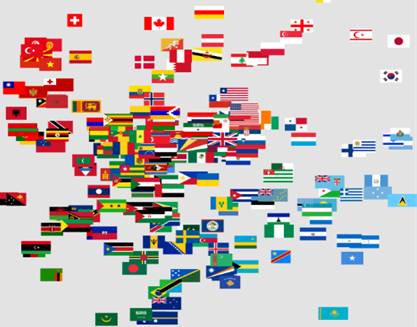
geom_flags from package ggimage enables using flags in ggplot2
geom_flags
ggimg displays images associated with each row of a dataset on the plot.
ggimg
gganimate extends the grammar of graphics as implemented by ggplot2 to animate of plots.
boxplot is the most used chart type to compare distribution of several groups
boxplot
{gt} package allows to make beautiful tables using the R programming language
{gt}