| abbreviated variable name | original variable name |
|---|---|
| AE_family | AE, familiäre Gründe |
| Ausbildung | Ausbildung |
| AE_human | AE, human., pol. Gründe |
| Duldung | Duldung |
| AEgestattung | Aufenthaltsgestattung |
| Antrag | Antrag gestellt |
| Ausbildung | Ausbildung |
| Befristete_AE | Befristete AE |
| FreizügG/EU | Aufenthaltsrecht nach FreizügG/EU |
| NVisa | Befristet, bes. Gründe & nationale Visa |
| Niederlassungserlaubnis | Unbefristete Niederlassungserlaubnis |
| OhneAT | Ohne AE | Duldung oder Gestattung |
| Erwerb | Befristete AE, Erwerbstätigkeit |
Datasource: Statistisches Bundesamt | Datastorage: GitHub
variables
The long variable names have been abbreviated to simplify editing and plotting. The names in the analysis and the names in the original are shown below:
Show some sample rows
dataclean
Code
# pivot data
piv_data <-
  data_raw |>
  pivot_longer(
    cols = !c(Bundesland, Stadt, Kreis...Landkreis),
    names_to = "status",
    values_to = "cnt"
    ) |>
  select(c(1,2,4,5))

#library(stringr)  # string replace, dedect
data <-
  piv_data |>
  rowwise() |>
  mutate(
    geschlecht = ifelse(
      endsWith(status, "_m"),  "male",
        ifelse(
          endsWith(status, "_w"), "female"
        )
      )
  ) |>
  mutate(across("status", str_replace, "_m|_w", "")) |>
  rename(
    "bundesland" = "Bundesland",
    "kreis" = "Stadt")

data |>
  head()
#> # A tibble: 6 × 5
#> # Rowwise:
#> bundesland kreis status cnt geschlecht
#> <chr> <chr> <chr> <int> <chr>
#> 1 Schleswig-Holstein Flensburg FreizügG.EU 0 male
#> 2 Schleswig-Holstein Flensburg FreizügG.EU 0 female
#> 3 Schleswig-Holstein Flensburg Niederlassungserlaubnis 0 male
#> 4 Schleswig-Holstein Flensburg Niederlassungserlaubnis 5 female
#> 5 Schleswig-Holstein Flensburg Befristete_AE 0 male
#> 6 Schleswig-Holstein Flensburg Befristete_AE 5 female
Diqqat! Achtung! Bнимание! Attention!
Columname Kreis / Landkreis mit / gespeichert. Normal R liest die Spalte so wie sie in DF gespeichrt ist, muss aber mit dplyr so angesprochen werden:
In Qarto sieht eingelesene Spaltenname Kreis / Landkreis -> Kreis...Landkreis
mapplot via ggplot
(data grouped by [Bundesländer])
Code
# libraries:
# pkg <- c("giscoR", "ggtext", "glue", "syfonts", "png", "ggimage", "fontawesome")
# lapply(pkg, library, character.only = TRUE)


# Group by bundesland ==========================================================
d_group <-
  data |>
  group_by(bundesland) |>
  summarise(pop = sum(cnt))

# Geo data for germany =========================================================
# library(giscoR)
ger <- gisco_get_nuts(
  year = 2024,
  epsg = 4326,
  nuts_level = 1,
  resolution =  "01",
  country = "Germany"
)

# Merge both data ==============================================================
df_de <-
  ger |>
  left_join(d_group, by = c("NUTS_NAME" = "bundesland"))

# new col mit abkurzung to from bundesländer to df
L_Abk <- c("SH", "MV", "TH", "NI", "BW", "NW", "RP", "SL", "BY", "BE", "SN",
           "BB", "HB", "HH", "ST", "HE")
df_de$abk <- L_Abk


# read image dop
img <- readPNG("gallery_img/dop.png")


# create mapplot
map_plt <-
  ggplot(df_de) +
  geom_sf(aes(fill = NUTS_NAME))+  #(aes(fill = NUTS_NAME), show.legend = FALSE) # disable legend
  geom_sf_label(aes(label = paste(abk, ":", pop)), fill = "aliceblue", col = "dodgerblue4") +
  geom_text(aes(y = 50.1, x =13.8, label = paste("Gesamt:", sum(pop))),
            stat = "unique",
            size = 3.6, size.unit = "mm", col = "dodgerblue4", fontface = "bold") +
  annotate(
    'rect',
    xmin = 12.4,
    xmax = 15.2,
    ymin = 49.9,
    ymax = 50.3,
    alpha = 0.5,
    fill = 'aliceblue',
    col = 'dodgerblue4',
  )+
  annotation_raster(img, xmin = 6, xmax = 8, ymin = 54, ymax = 55.5, interpolate = FALSE) +
  theme_minimal()+
  labs(
    title = "**Usbeken in Deutschland**",
    subtitle = "nach Bundesländern",
    caption = social_caption_map
  ) +
  guides(fill = guide_legend(title="Bundesland")) +
  theme(plot.title = ggtext::element_markdown(size = 13, color = "steelblue4", face = "bold"),
        plot.subtitle = element_markdown(),
        plot.caption = element_markdown(size = 11), # element_textbox_simple()
        plot.caption.position = "plot",             #plot, margin, panel,
        legend.title = element_text(color = "darkgrey", size = 12, face = "bold"),
        axis.text.x=element_blank(),
        axis.text.y=element_blank(),
        axis.ticks=element_blank(),
        axis.title.x=element_blank(),
        axis.title.y=element_blank())

map_plt
barplot via ggplot
(grouped data by [Aufenthaltsstatus])
Code
# Group by Status ==============================================================
group_stat <-
  data |>
  group_by(status) |>
  summarise(n = sum(cnt))

# create plot ------------------------------------------------------------------
bar_plt <-
  ggplot(group_stat, aes(x = n, y = reorder(n, status), fill = status))+
  geom_col()+

  geom_text(aes(label = n),
            hjust = -0.1, color = "darkgrey", fontface = "bold")+

  scale_fill_discrete(name = "Aeufenthaltsstatus", labels = legnd) +
  labs(
    title = "Usbeken in Deutschlan, nach Aufenthaltsstatus",
    caption = social_caption_map,
    x = "Zahl (k = 1000)" ) +
  scale_x_continuous(
    labels = function(x) paste0(x/1000, "k"),
    expand = expansion(c(0.01, 0.05))) +
  theme_classic() +
  theme(
    plot.title = ggtext::element_markdown(
      size = 13, color = "steelblue4", face = "bold"),
    plot.caption = ggtext::element_markdown(size = 11),
    axis.title.y = element_blank(),
    axis.text.y = element_blank(),
    axis.line = element_line(colour = "gray"),
    panel.grid.major.x = element_blank(),
    panel.grid.minor.x = element_blank(),
    legend.position = c(0.8, 0.40)
  )

bar_plt
funnel chart via ggplot
(grouped data by [Aufenthaltsstatus])
Code
group_status <-
  data |>
  group_by(status, geschlecht) |>
  summarise(cnt = sum(cnt)) |>
  mutate(
    n = case_when(
      geschlecht == "female" ~ cnt*-1,
      TRUE ~ cnt
    )
  )

brks <- c(seq(-3000, 3000, by = 500))
lbls = c(seq(30, 0, -5), seq(5, 30, 5))
p <- group_status |>
  ggplot(aes(x = reorder(status, n), y =  n, fill = geschlecht))+
  geom_bar(stat = "identity", width = .6) +
  scale_y_continuous(breaks = brks, labels = lbls) +
  scale_x_discrete(labels = legnd) +
  geom_label(aes(label = abs(n)), colour = "blue", fontface="bold", size=3.5) +
  guides(fill = guide_legend(
    title = "Geschlecht:",
    override.aes = aes(label = ""))) +
  coord_flip() +
  labs(title="Usbeken in Deutschland nach Aufenthaltsstatus",
       caption = social_caption_map
       ) +
  theme_minimal() +
  theme(plot.title = ggtext::element_markdown(
          size = 13, color = "steelblue4", face = "bold"),
        plot.caption = ggtext::element_markdown(size = 11),
        axis.title.x = element_blank(),
        axis.text.x = element_blank(),
        axis.title.y = element_blank(),
        axis.ticks = element_blank(),
        panel.grid.major.x = element_blank(),
        panel.grid.minor.x = element_blank(),
        legend.background = element_rect(),
        legend.position = "top")
p
funnel chart via ggplot
(grouped data by [Aufenthaltsstatus])
Code
group_bl <-
  data |>
  group_by(bundesland, geschlecht) |>
  summarise(cnt = sum(cnt)) |>
  mutate(                          # einen Teil die Daten musste ich negativ machen,
    n = case_when(                 # weil sons stacked bar wurde
      geschlecht == "female" ~ cnt*-1,
      TRUE ~ cnt
    )
  )

group_bl |>
  ggplot(aes(x = reorder(bundesland,n), y =  n, fill = geschlecht))+
  geom_bar(stat = "identity", width = .6) +
  scale_y_continuous(breaks = brks, labels = lbls) +
  geom_label(aes(label = abs(n)), colour = "floralwhite", fontface="bold", size=4) +
  guides(fill = guide_legend(
    title = "Geschlecht:",
    override.aes = aes(label = ""))) +
  coord_flip() +
  labs(title="Usbeken in Deutschland nach Geschlecht in Bundesländern") +
  theme_minimal() +
  theme(plot.title = ggtext::element_markdown(
          size = 13, color = "steelblue4", face = "bold"),
        plot.caption = ggtext::element_markdown(size = 11),
        axis.title.x = element_blank(),
        axis.text.x = element_blank(),
        axis.title.y = element_blank(),
        panel.grid.major.x = element_blank(),
        panel.grid.minor.x = element_blank(),
        legend.background = element_rect(),
        legend.position = "top")
prepare date (use data from R)
group by [status] in pandas
show the code
import numpy as np
import pandas as pd
from IPython.display import display, Markdown, HTML

var_name = {"AE_family": "AE, familiäre Gründe",
           "Ausbildung": "Ausbildung ",
           "AE_human": "AE, human., pol. Gründe",
           "Duldung": "Duldung ",
           "AEgestattung": "Aufenthaltsgestattung",
           "Antrag": "Antrag gestellt",
           "Ausbildung": "Ausbildung",
           "Befristete_AE": "Befristete AE",
           "FreizügG/EU": "Aufenthaltsrecht nach FreizügG/EU",
           "NVisa": "Befristet, bes. Gründe & nationale Visa",
           "Niederlassungserlaubnis": "Unbefristete Niederlassungserlaubnis",
           "OhneAT": "Ohne AE oder Duldung oder Gestattung",
           "Erwerb": "Befristete AE, Erwerbstätigkeit"}

df_r = pd.DataFrame(r.group_status)
# rename rownames
def replace_rname(name):
    return var_name.get(name, name)
df_r["status"] = df_r["status"].apply(replace_rname)
# pivot wide
data = df_r.pivot(index = "status", columns = "geschlecht", values = "cnt").reset_index()
summa = np.abs(data.female + data.male)
data["summa"] = summa

df = data.copy()
df = df.sort_values(
    "summa",
    ascending=False,
    inplace=False,
    ignore_index=False,
    key=None
)

female = df.female
male = df.male
labels = df.status

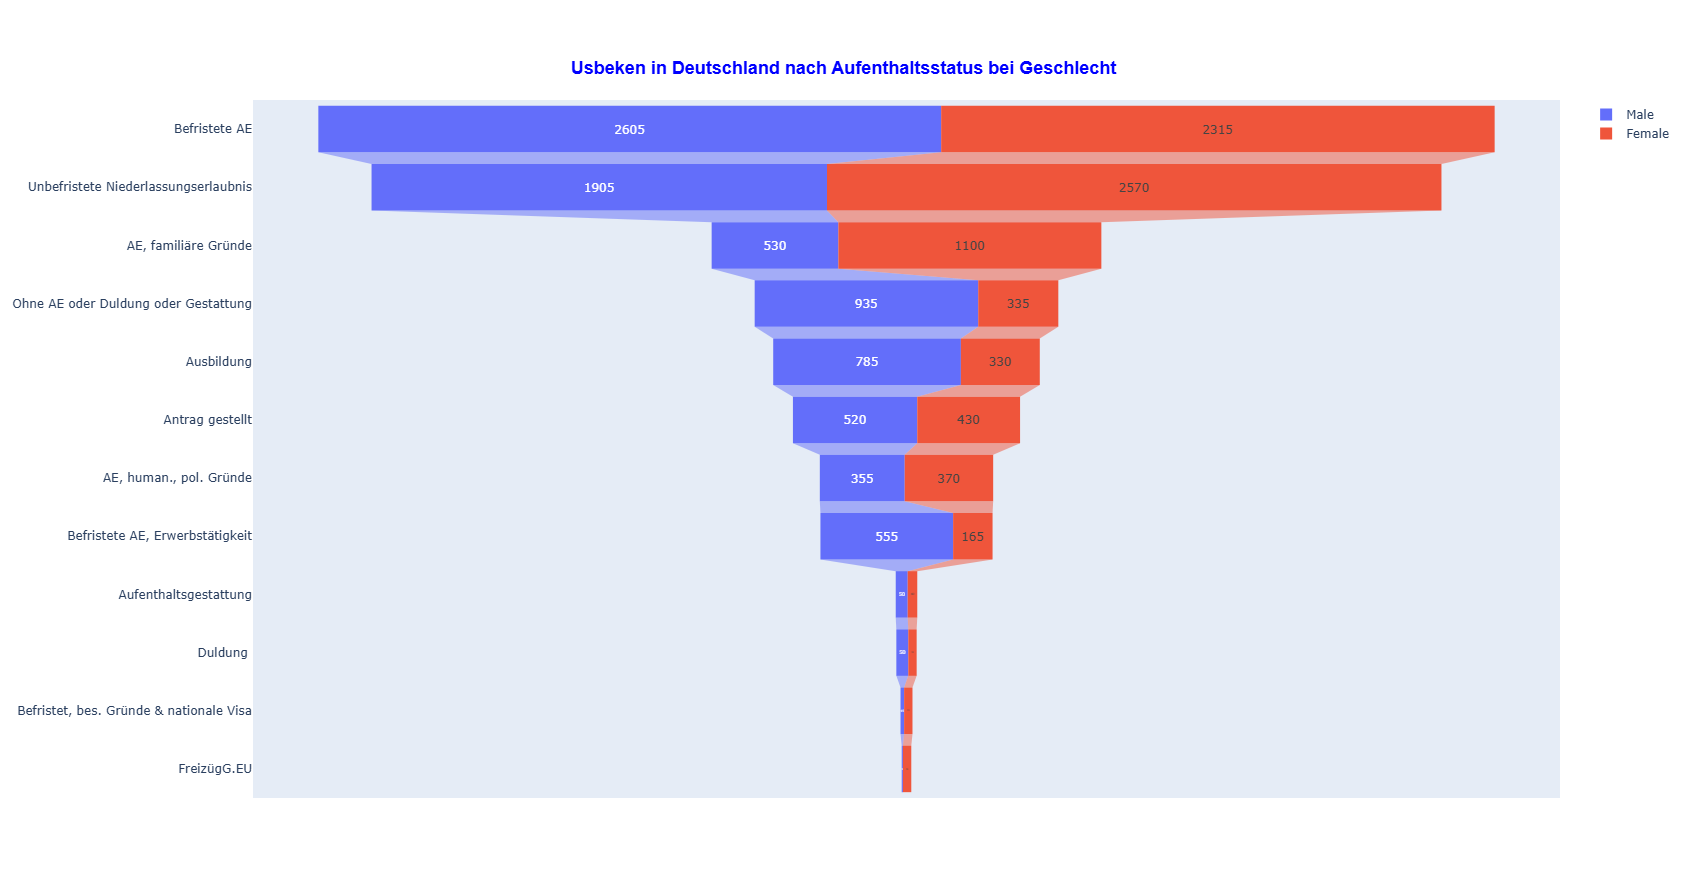
Markdown(df.to_markdown(index = False))| status | female | male | summa |
|---|---|---|---|
| Befristete AE | 2315 | 2605 | 4920 |
| Unbefristete Niederlassungserlaubnis | 2570 | 1905 | 4475 |
| AE, familiäre Gründe | 1100 | 530 | 1630 |
| Ohne AE oder Duldung oder Gestattung | 335 | 935 | 1270 |
| Ausbildung | 330 | 785 | 1115 |
| Antrag gestellt | 430 | 520 | 950 |
| AE, human., pol. Gründe | 370 | 355 | 725 |
| Befristete AE, Erwerbstätigkeit | 165 | 555 | 720 |
| Aufenthaltsgestattung | 40 | 50 | 90 |
| Duldung | 35 | 50 | 85 |
| Befristet, bes. Gründe & nationale Visa | 35 | 15 | 50 |
| FreizügG.EU | 35 | 5 | 40 |
plot by [status] with plotly
show the code
from plotly import graph_objects as go


fig = go.Figure()

fig.add_trace(go.Funnel(
    name = 'Male',
    y = list(labels),
    x = list(male),
    textinfo = "value"))

fig.add_trace(go.Funnel(
    name = 'Female',
    orientation = "h",
    y = list(labels),
    x = list(female),
    textposition = "inside",
    textinfo = "value"))

fig.update_layout(
    title='<b>Usbeken in Deutschland nach Aufenthaltsstatus bei Geschlecht</b>',
    title_font=dict(size=18,
                    color='blue',
                    family='Arial'),
    title_x=0.50,  # Title aligned with grid
    title_y=0.93   # Title positioned near the top vertically
)
#fig.show()
print(fig)

#fig.write_image("gallery/plots/fig1.png")
#plotly.offline.plot(fig, filename='gallery/plots/fig1.png', image='png')
group by [bundesland]
show the code
import numpy as np
import pandas as pd
from IPython.display import display, Markdown, HTML

# load R data
df_bl_r = pd.DataFrame(r.group_bl)

# pivot wide
data_bl = df_bl_r.pivot(index = "bundesland", columns = "geschlecht", values = "cnt").reset_index()
sum_bl = np.abs(data_bl.female + data_bl.male)
data_bl["summa"] = sum_bl

df_bl = data_bl.copy()
df_bl = df_bl.sort_values(
    "summa",
    ascending=False,
    inplace=False,
    ignore_index=False,
    key=None
)

# vars for plot
fem = df_bl.female
mal = df_bl.male
lab = df_bl.bundesland


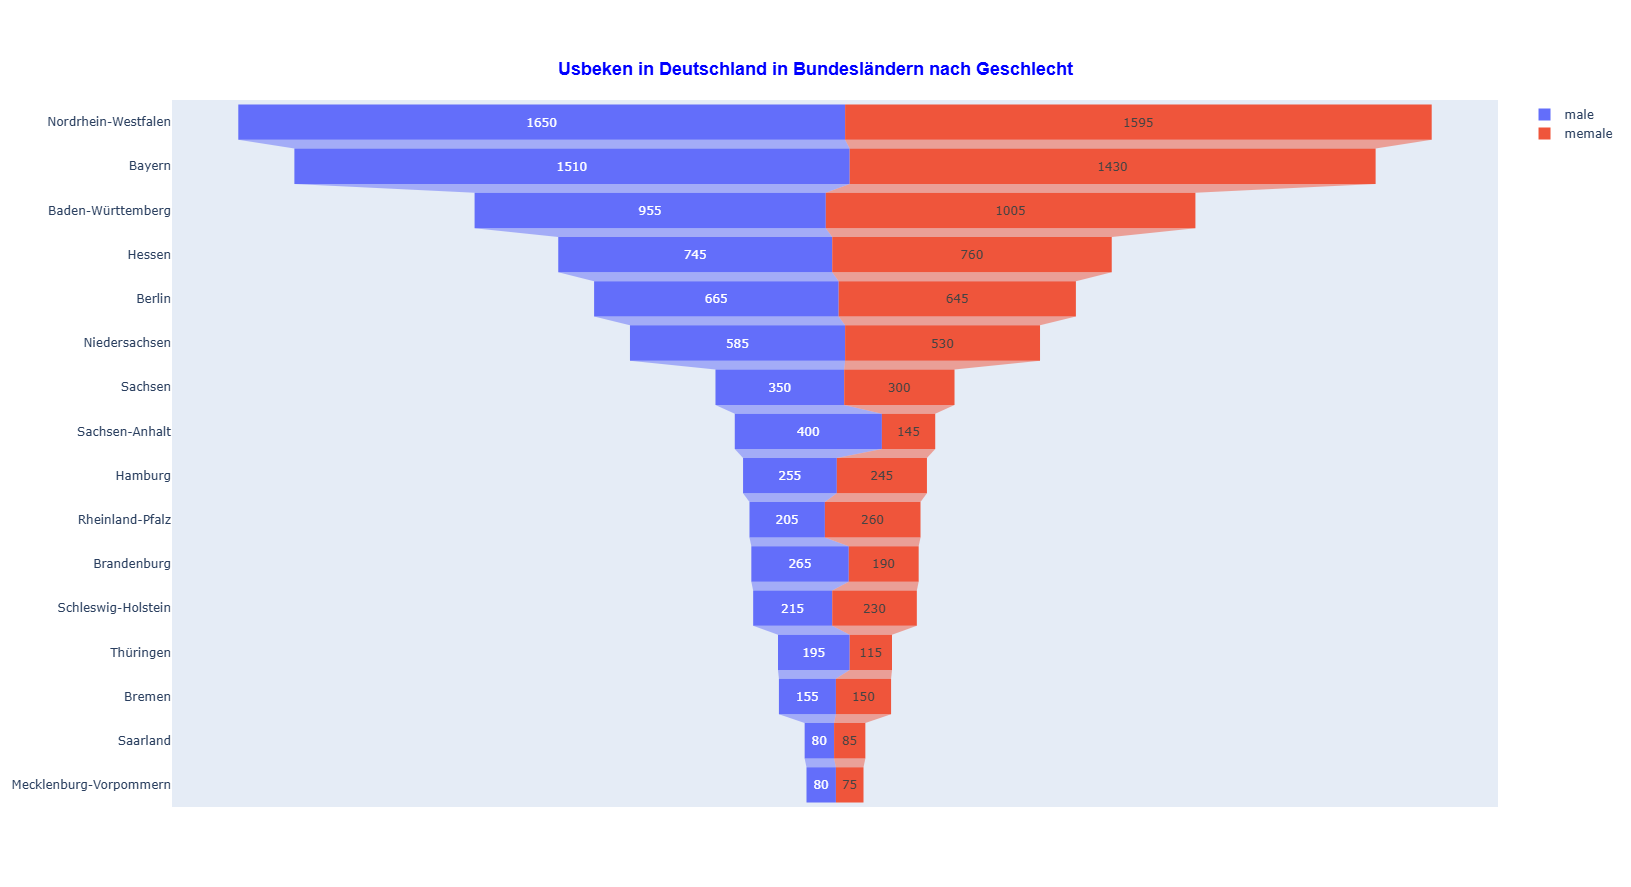
Markdown(df_bl.to_markdown(index = False))| bundesland | female | male | summa |
|---|---|---|---|
| Nordrhein-Westfalen | 1595 | 1650 | 3245 |
| Bayern | 1430 | 1510 | 2940 |
| Baden-Württemberg | 1005 | 955 | 1960 |
| Hessen | 760 | 745 | 1505 |
| Berlin | 645 | 665 | 1310 |
| Niedersachsen | 530 | 585 | 1115 |
| Sachsen | 300 | 350 | 650 |
| Sachsen-Anhalt | 145 | 400 | 545 |
| Hamburg | 245 | 255 | 500 |
| Rheinland-Pfalz | 260 | 205 | 465 |
| Brandenburg | 190 | 265 | 455 |
| Schleswig-Holstein | 230 | 215 | 445 |
| Thüringen | 115 | 195 | 310 |
| Bremen | 150 | 155 | 305 |
| Saarland | 85 | 80 | 165 |
| Mecklenburg-Vorpommern | 75 | 80 | 155 |
plot by [bundesland] with plotly
show the code
from plotly import graph_objects as go
import plotly.io as pio
#import plotly
# import plotly.io as pio
# png_renderer = pio.renderers["png"]
# png_renderer.width = 500
# png_renderer.height = 500
#
# pio.renderers.default = "png"


fig_bl = go.Figure()

fig_bl.add_trace(go.Funnel(
    name = 'male',
    y = list(lab),
    x = list(mal),
    textinfo = "value"))

fig_bl.add_trace(go.Funnel(
    name = 'memale',
    orientation = "h",
    y = list(lab),
    x = list(fem),
    textposition = "inside",
    textinfo = "value"))

fig_bl.update_layout(
    title='<b>Usbeken in Deutschland in Bundesländern nach Geschlecht</b>',
    title_font=dict(size=18,
                    color='blue',
                    family='Arial'),
    title_x=0.50,  # Title aligned with grid
    title_y=0.93   # Title positioned near the top vertically
)
# # show as static img
# fig_bl.show(renderer="png")
# # write as image
# pio.write_image(fig_bl, "C:/Users/sultanov/Documents/blog/gallery/plots/figname.png") 


